Using the LLooM Workbench
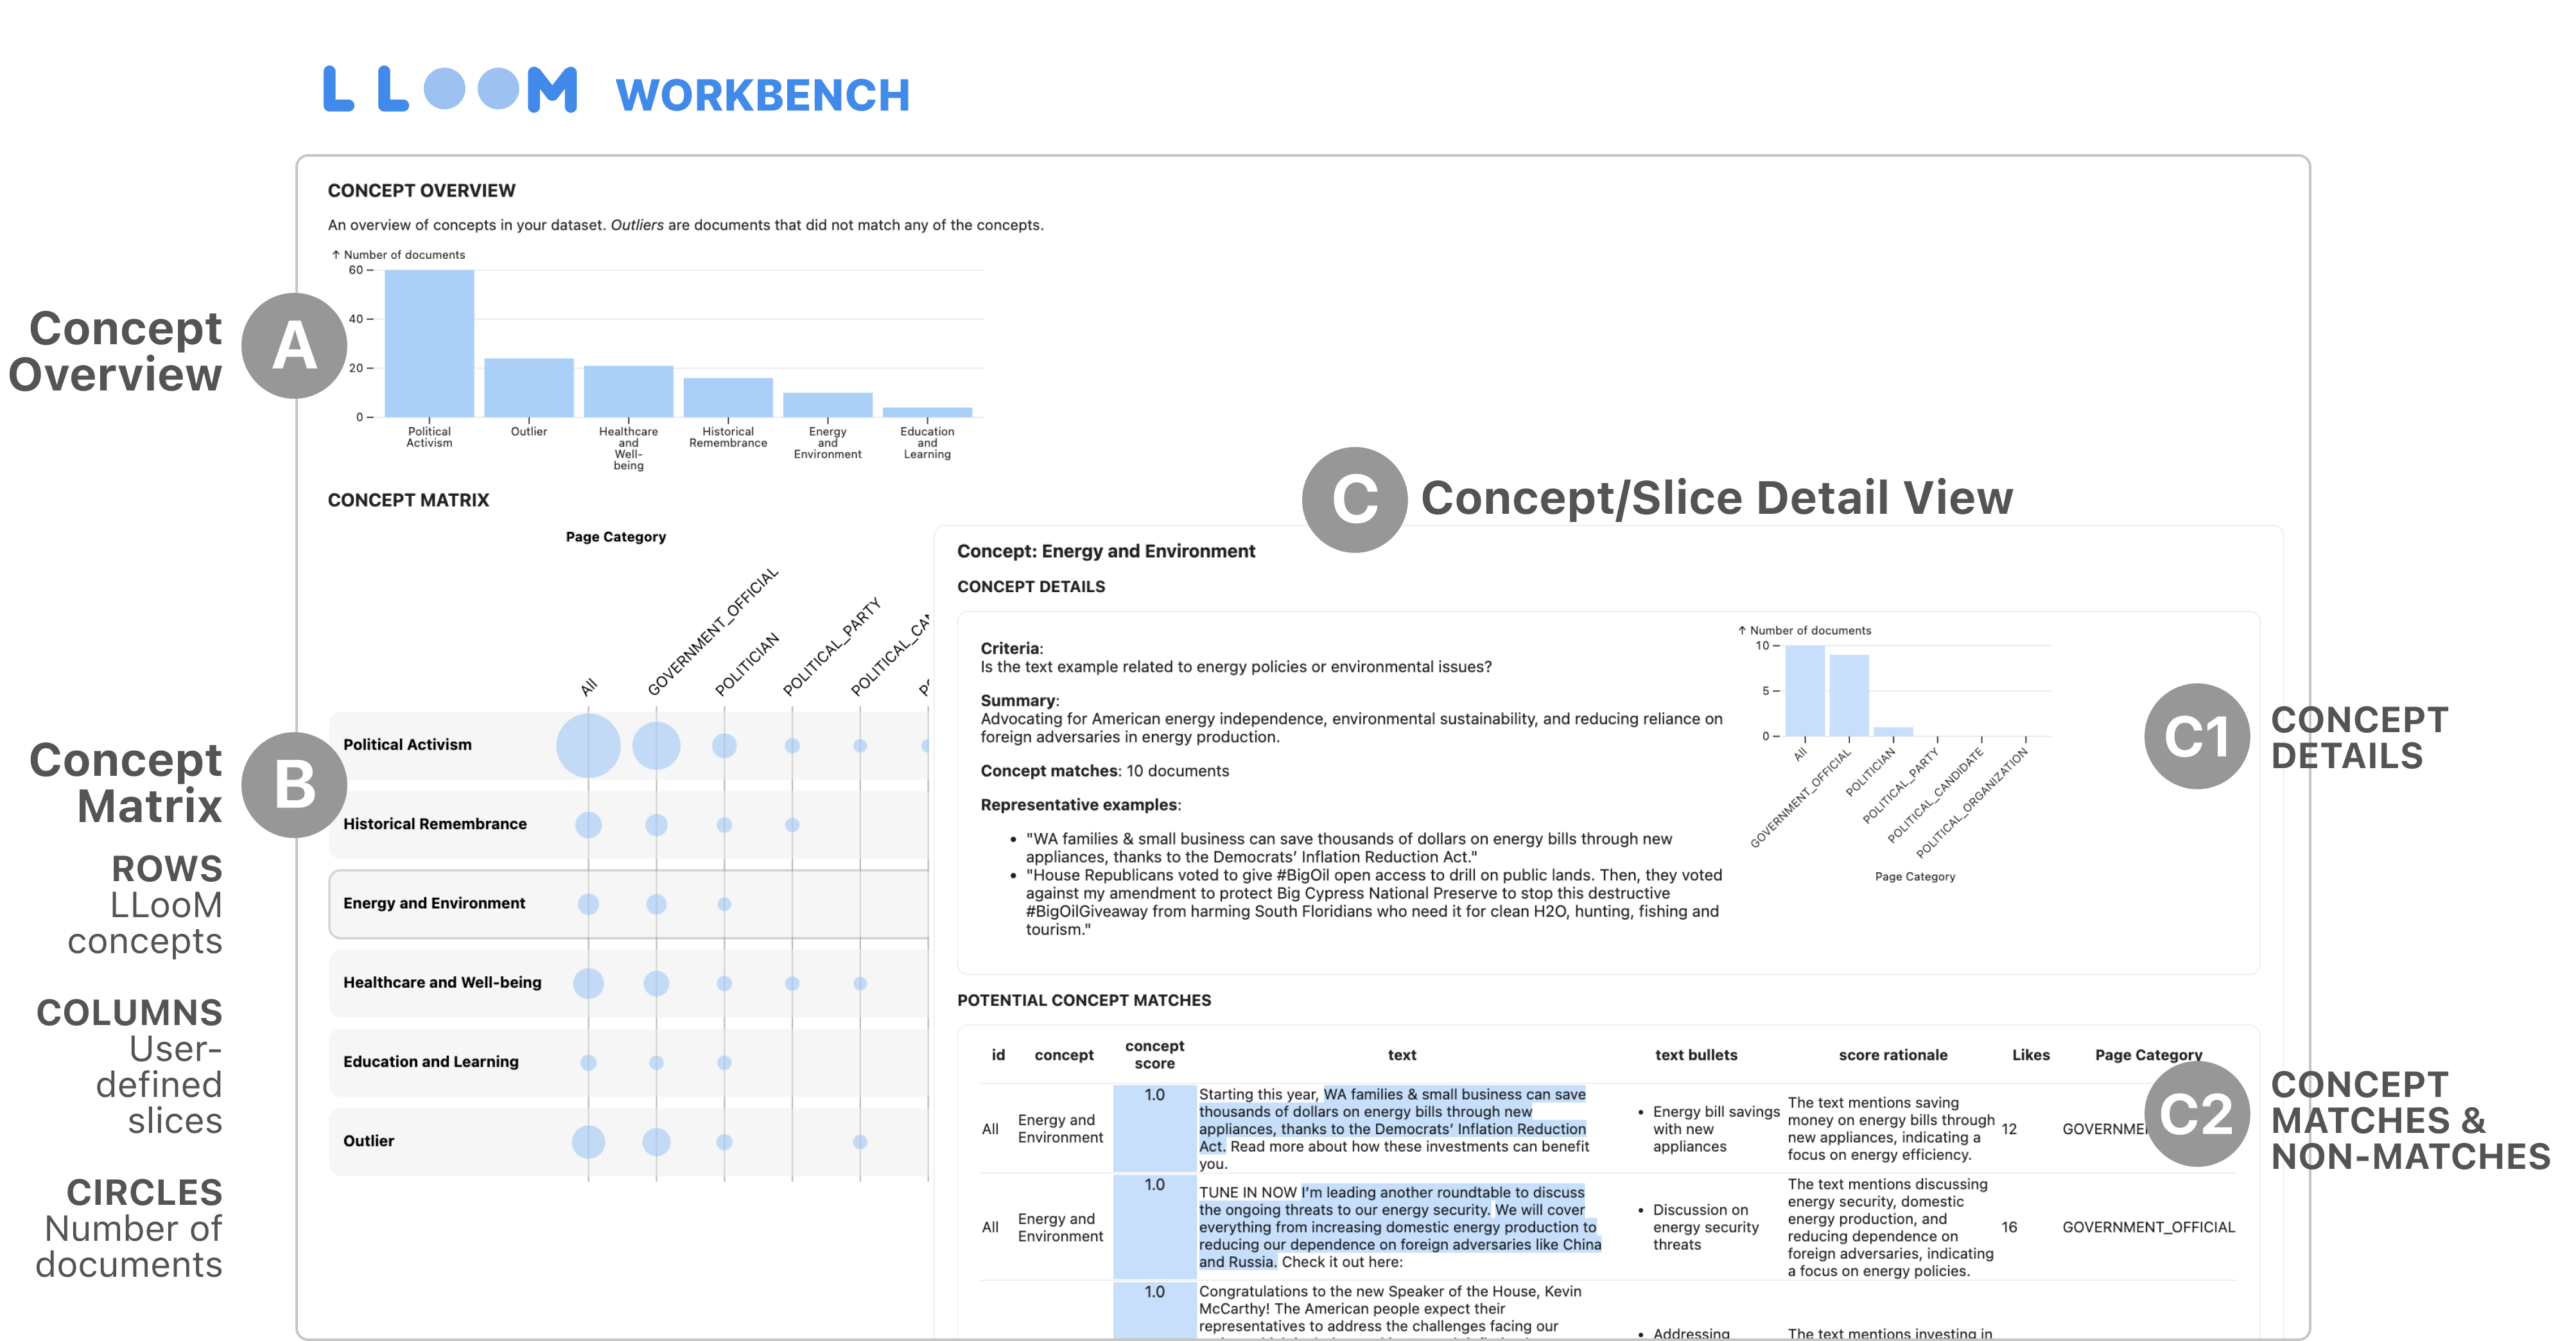
The LLooM Workbench visualization consists of several components. Here, we'll walk through in a bit more detail on how to work with this interactive visualization.

A: Concept Overview
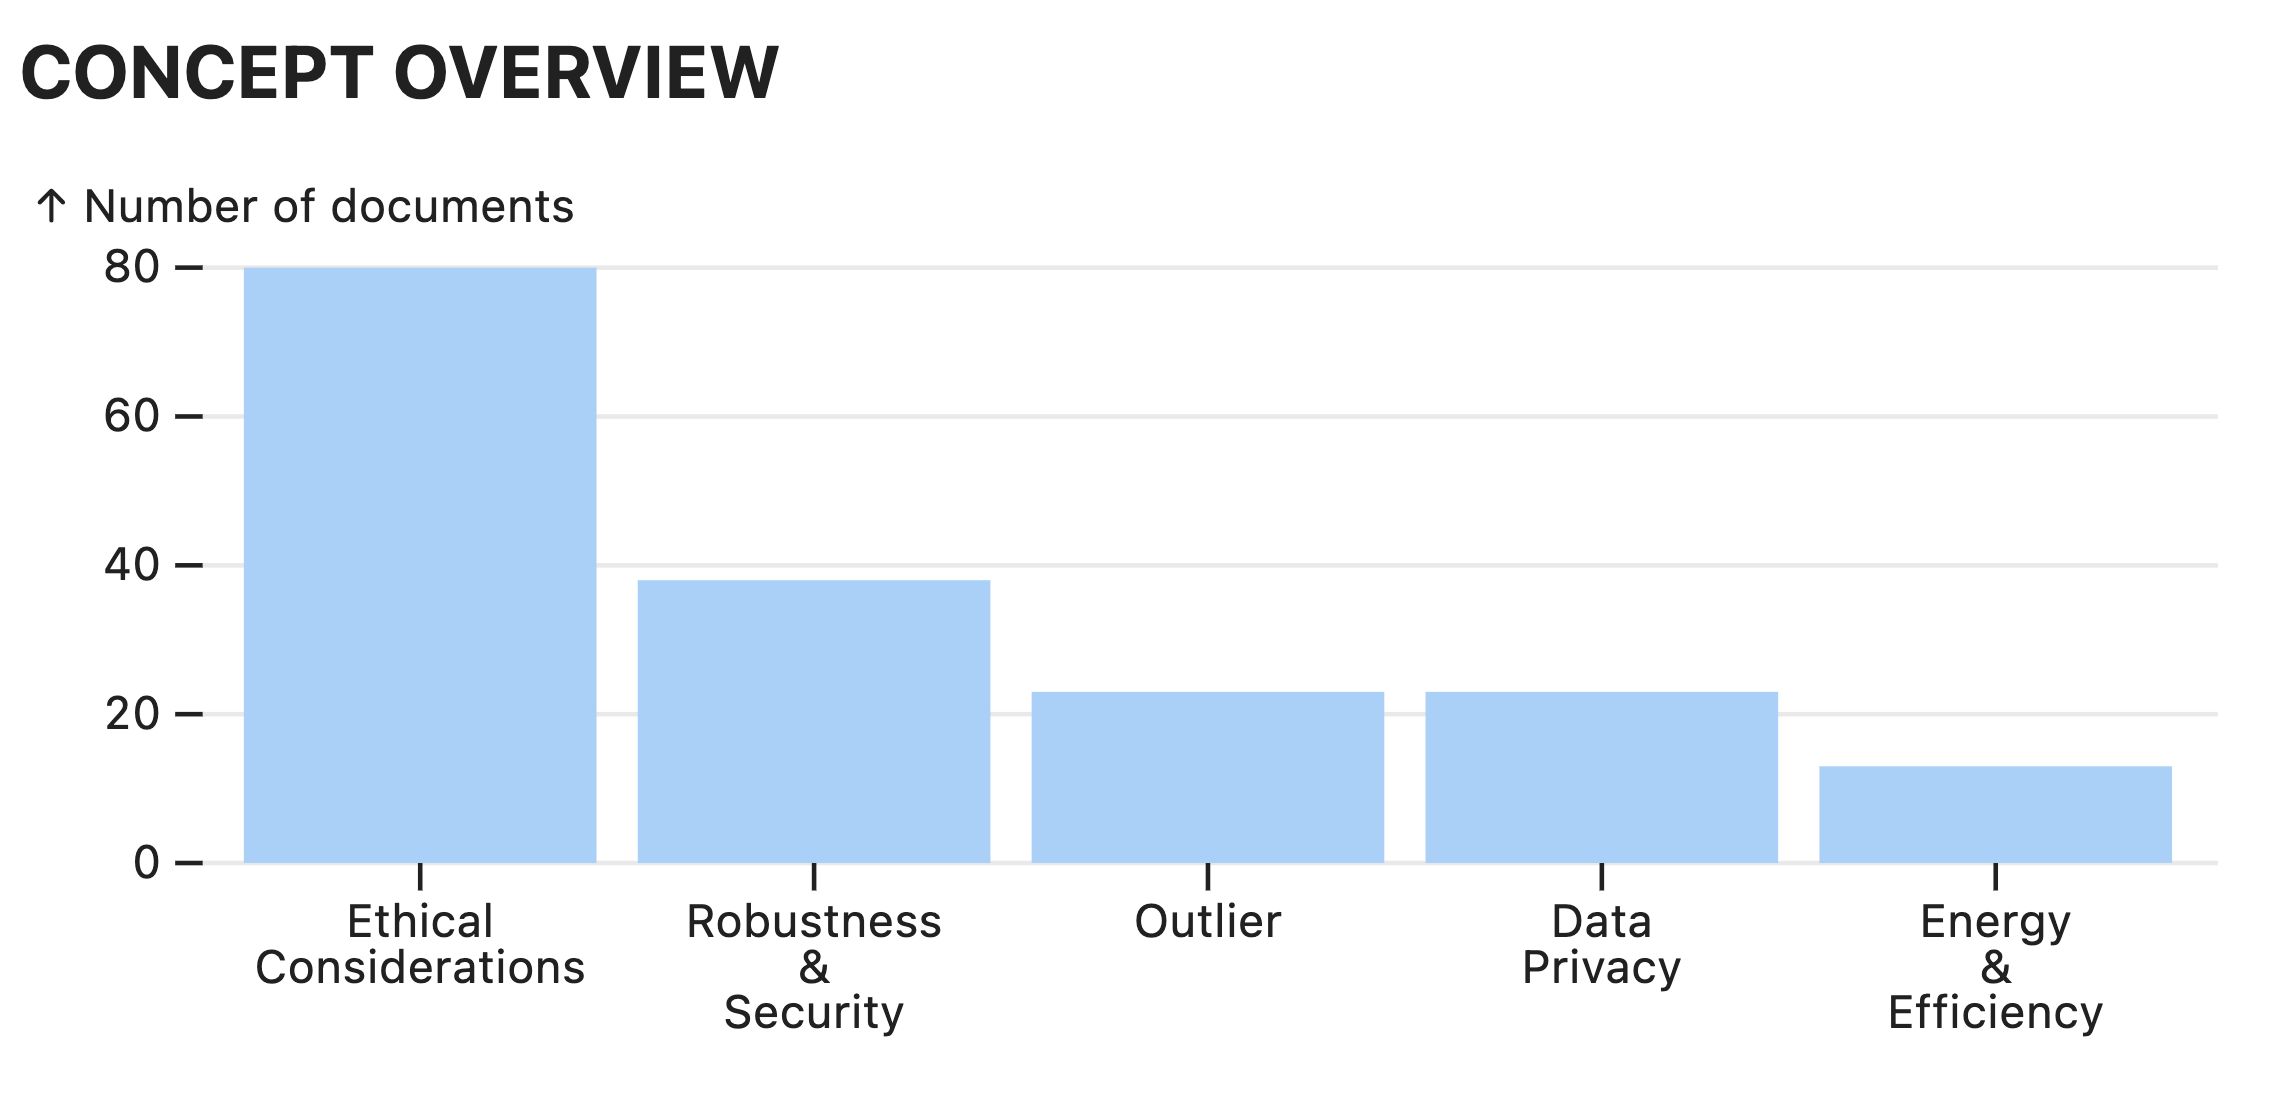
The Concept Overview chart is at the top of the LLooM Workbench visualization. This chart is intended to provide a high-level summary of concepts observed in the dataset. The x-axis displays all concepts (including the Outlier set), and the y-axis plots the number of documents that matched the concept.

B: Concept Matrix
The Concept Matrix is below the Concept Overview and comprises the majority of the LLooM Workbench visualization. The left side is the Matrix view, which displays concepts as rows and slices as columns. The right side will display Detail views: clicking on a concept row header will open the corresponding Concept Detail view, and clicking on a slice column header will open the corresponding Slice Detail view.
Circle size
The circles at the intersection of each concept and slice indicate the number of documents in that concept and slice: a larger circle indicates a higher number of docs, and a smaller circle indicates a lower number of docs.
Circle normalization
Since there are different numbers of documents within each concept and slice, absolute document counts aren't always helpful. We can optionally normalize the circle size either by concept or by slice.
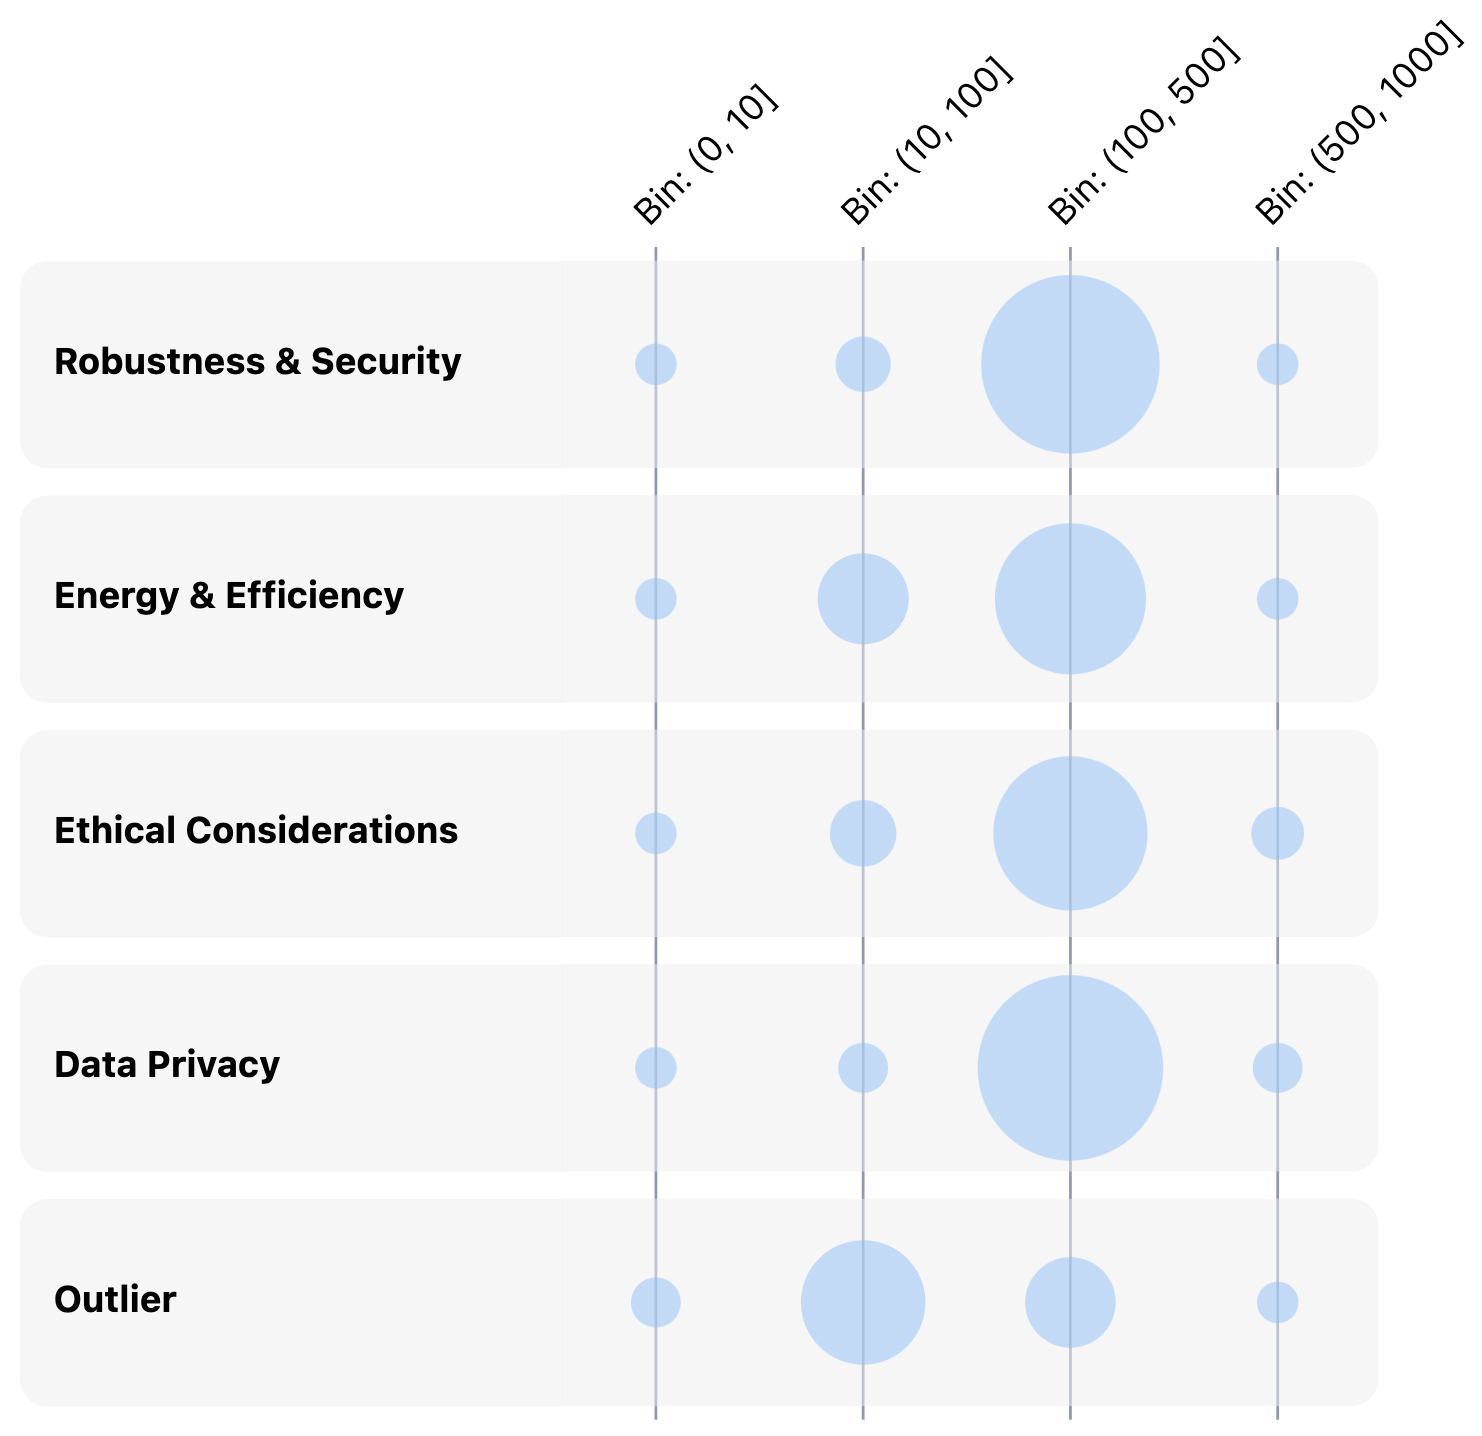
norm_by="concept": (norm by row) The size of the circles in each concept row represents the fraction of examples in that concept that fall into each slice column.When to use CONCEPT normalization
- Helpful if we want to see patterns within a concept and across slices.
- Example: If we wanted to see how a paper topic like "Artificial Intelligence" (concept) changes over decades (slices), concept normalization could let us see more clearly how the relative fraction of papers changes between each decade.

Concept normalization helps us see patterns within a concept row: This matrix has slices based on a word-count field. For documents matching the "Robustness & Security" concept, most had 100-500 words (second column from the right). We see a similar pattern looking at each of the other concept rows.
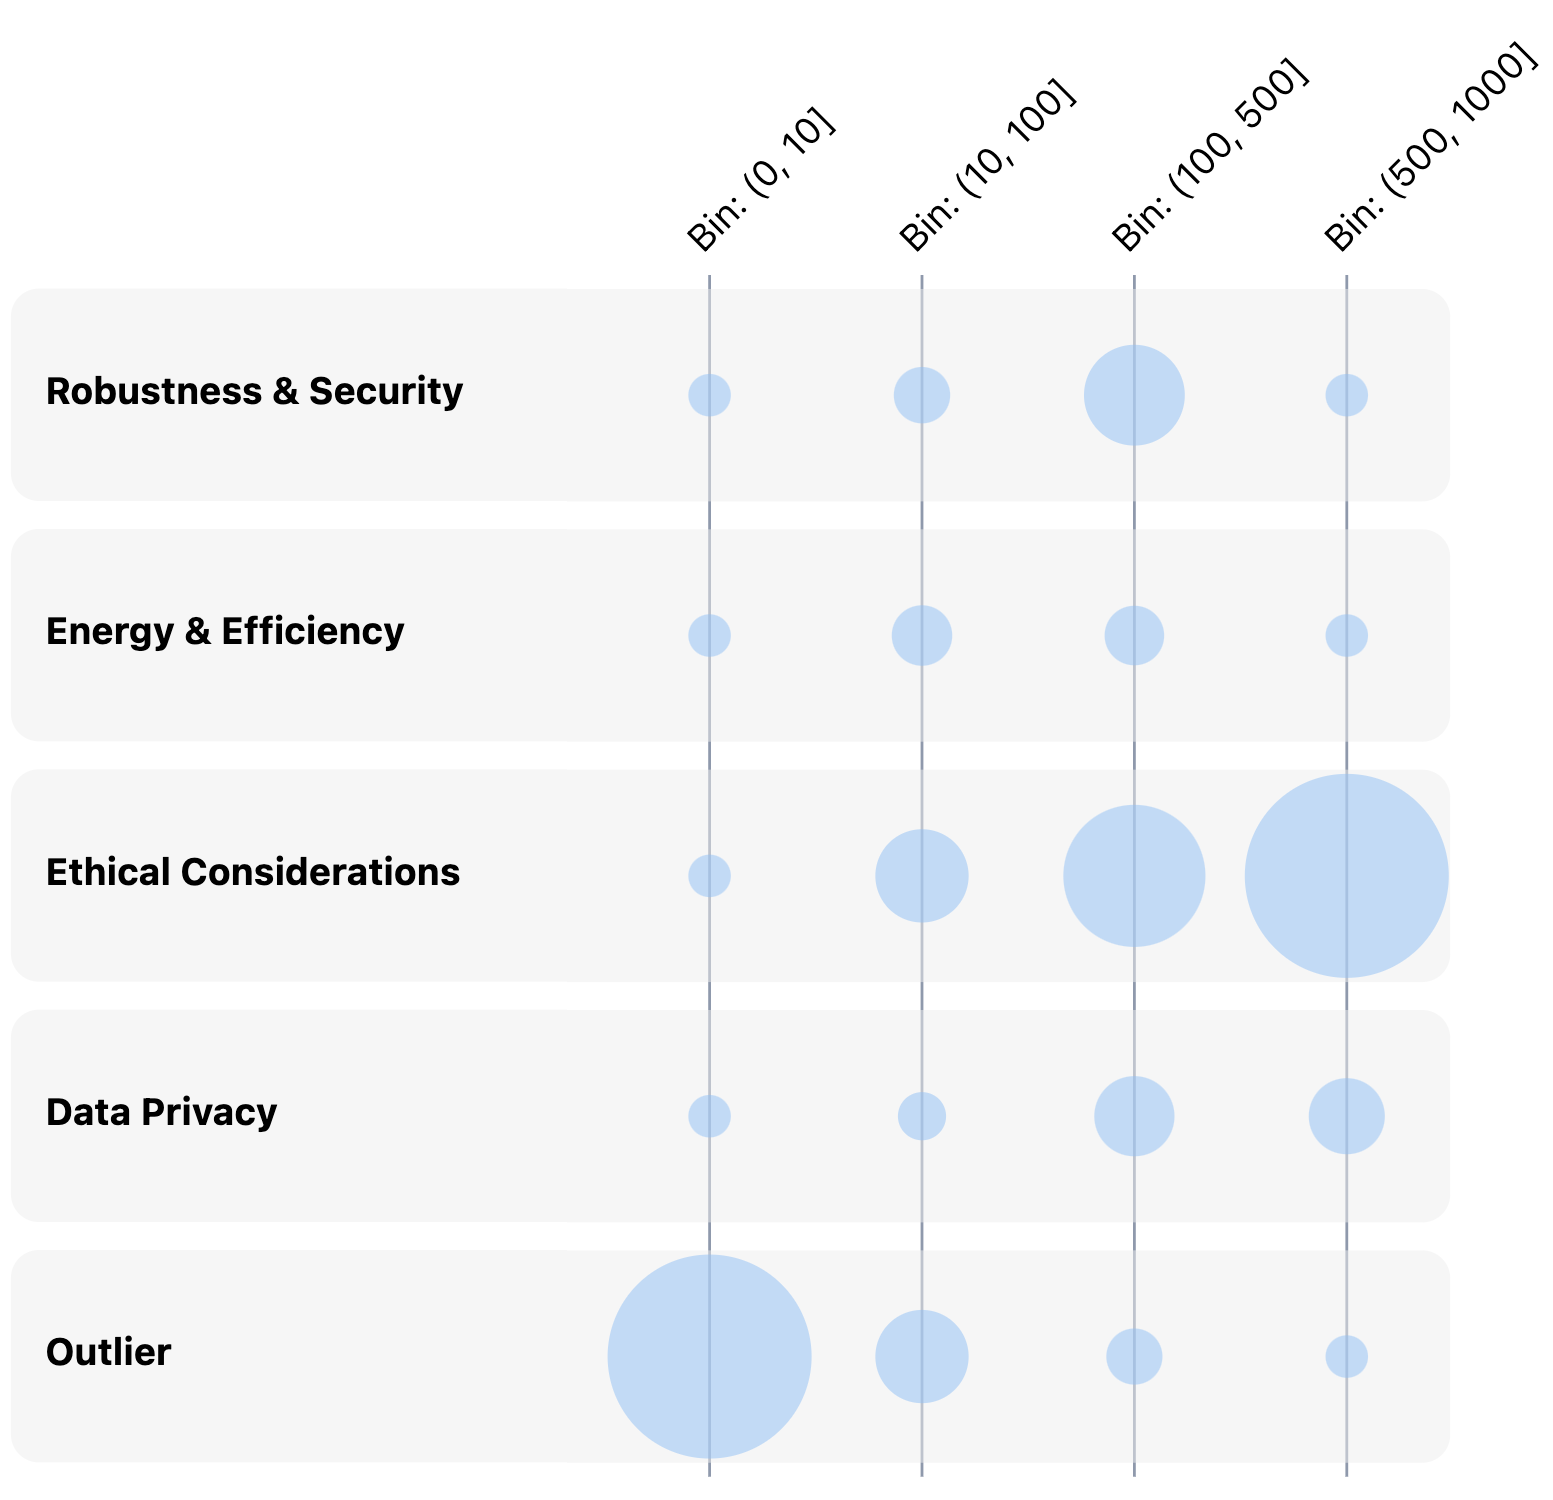
norm_by="slice": (norm by column) The size of the circles in each slice column represents the fraction of examples in that slice that match each concept row.When to use SLICE normalization
- Helpful if we want to see patterns within a slice and across concepts.
- Example: If we wanted to see what attributes of social media posts (concepts) are correlated with the highest toxicity rating (slice), slice normalization could let us better see which concepts match the highest fraction of these highest-toxicity posts.

Slice normalization helps us see patterns within a slice column: For the slice of 500-1000-word statements (far right column), "Ethical Considerations" were far more prevalent than other concepts. For the 100-500-word bin, "Robustness & Security" and "Ethical Considerations" were most common.
C: Detail Views
Concept Detail view
Clicking on a concept row header opens its Concept Detail view. This view contains three cards:
- C1: Concept details: This card provides key information about the concept including the inclusion criteria, summary, representative examples, and the number of matching documents.
- C2: Potential concept matches: This table displays a summary of documents that matched the concept, where each row represents one document. It includes the following columns:
concept score: The 0-1 score assigned to the document. By default, only documents with a score of 1 will appear as matches here.text: The full document text. If the model has identified spans of relevant text for the concept, they will be highlighted in blue.text bullets: Bulleted summaries of the document text.score rationale: The LLM's rationale for providing the given concept score.<slice column>: The slice column values ifslice_colwas specified.
TIP
Click on the header for a column in the table to sort by that column.
- C2: Concept non-matches: This table displays all documents that did not match the concept, with the same columns as the concept match table above.
Slice Detail view
Similarly, clicking on a slice column header opens its Slice Detail view. This view contains two cards:
- C1: Slice details: This card provides key information about the slice including the name and the number of documents in the dataset matching the slice.
- C2: Slice examples: This table displays all documents in the slice, where each row again represents one document. The table includes the following columns:
text: The full document text.<concept name>: The score for the concept with the indicated name. There will be a column for each concept.<slice column>: The slice column values.
Key terms
Here we provide a brief reference on terms used throughout the LLooM Workbench.
CONCEPT GENERATION
- Concept: A natural language description of an emergent theme, trend, or pattern in text.
- Criteria: The explicit inclusion criteria used to determine whether a given document matches a concept.
- Summary: A summary of the documents that matched the concept.
- Representative examples: A sample of quotes from input documents that were used to generate the concept.
- Seed: A word or phrase to steer the direction of concept generation. LLooM uses the provided seed term to condition the Distill and Synthesize operators to pay attention to a particular aspect of the data. Ex: "social issues" for a political dataset or "evaluation methods" for an academic papers dataset.
CONCEPT SCORING
- Concept score: The estimated likelihood that a document matches the given concept, from 0 (lowest likelihood) to 1 (highest likelihood).
- Concept matches: Documents that matched a concept, by default operationalized as those that received the highest concept score of 1.
VISUALIZATION
- Slice: A user-specified data grouping based on additional columns in the input dataframe. LLooM automatically creates groups for strings (as categorical variables) or numbers (as binned continuous variables).
- Outlier: Any input document that does not match any of the active concepts.
